

The first thing I do when a new Rugby World Cup price hits the screen
The first thing I do when a new Rugby World Cup price hits the screen is not check who is favourite. I check who has moved. After seven years of building models for this tournament, I have learned that the price tag matters less than the journey. A number sitting at decimal 3.50 today might have been 4.20 last week, and that drift tells you more about the market’s read on a team than any preview ever will.
Most UK punters I speak to start in the opposite place. They open the outright market, see New Zealand at the top, and back the All Blacks because the number looks short. That is not analysis. That is brand-following with a stake attached. The British market has roughly 290 million online sports bets going through each month, and a meaningful slice of those are placed on tournament markets without anyone pausing to ask what the price actually represents. This article is about that pause.
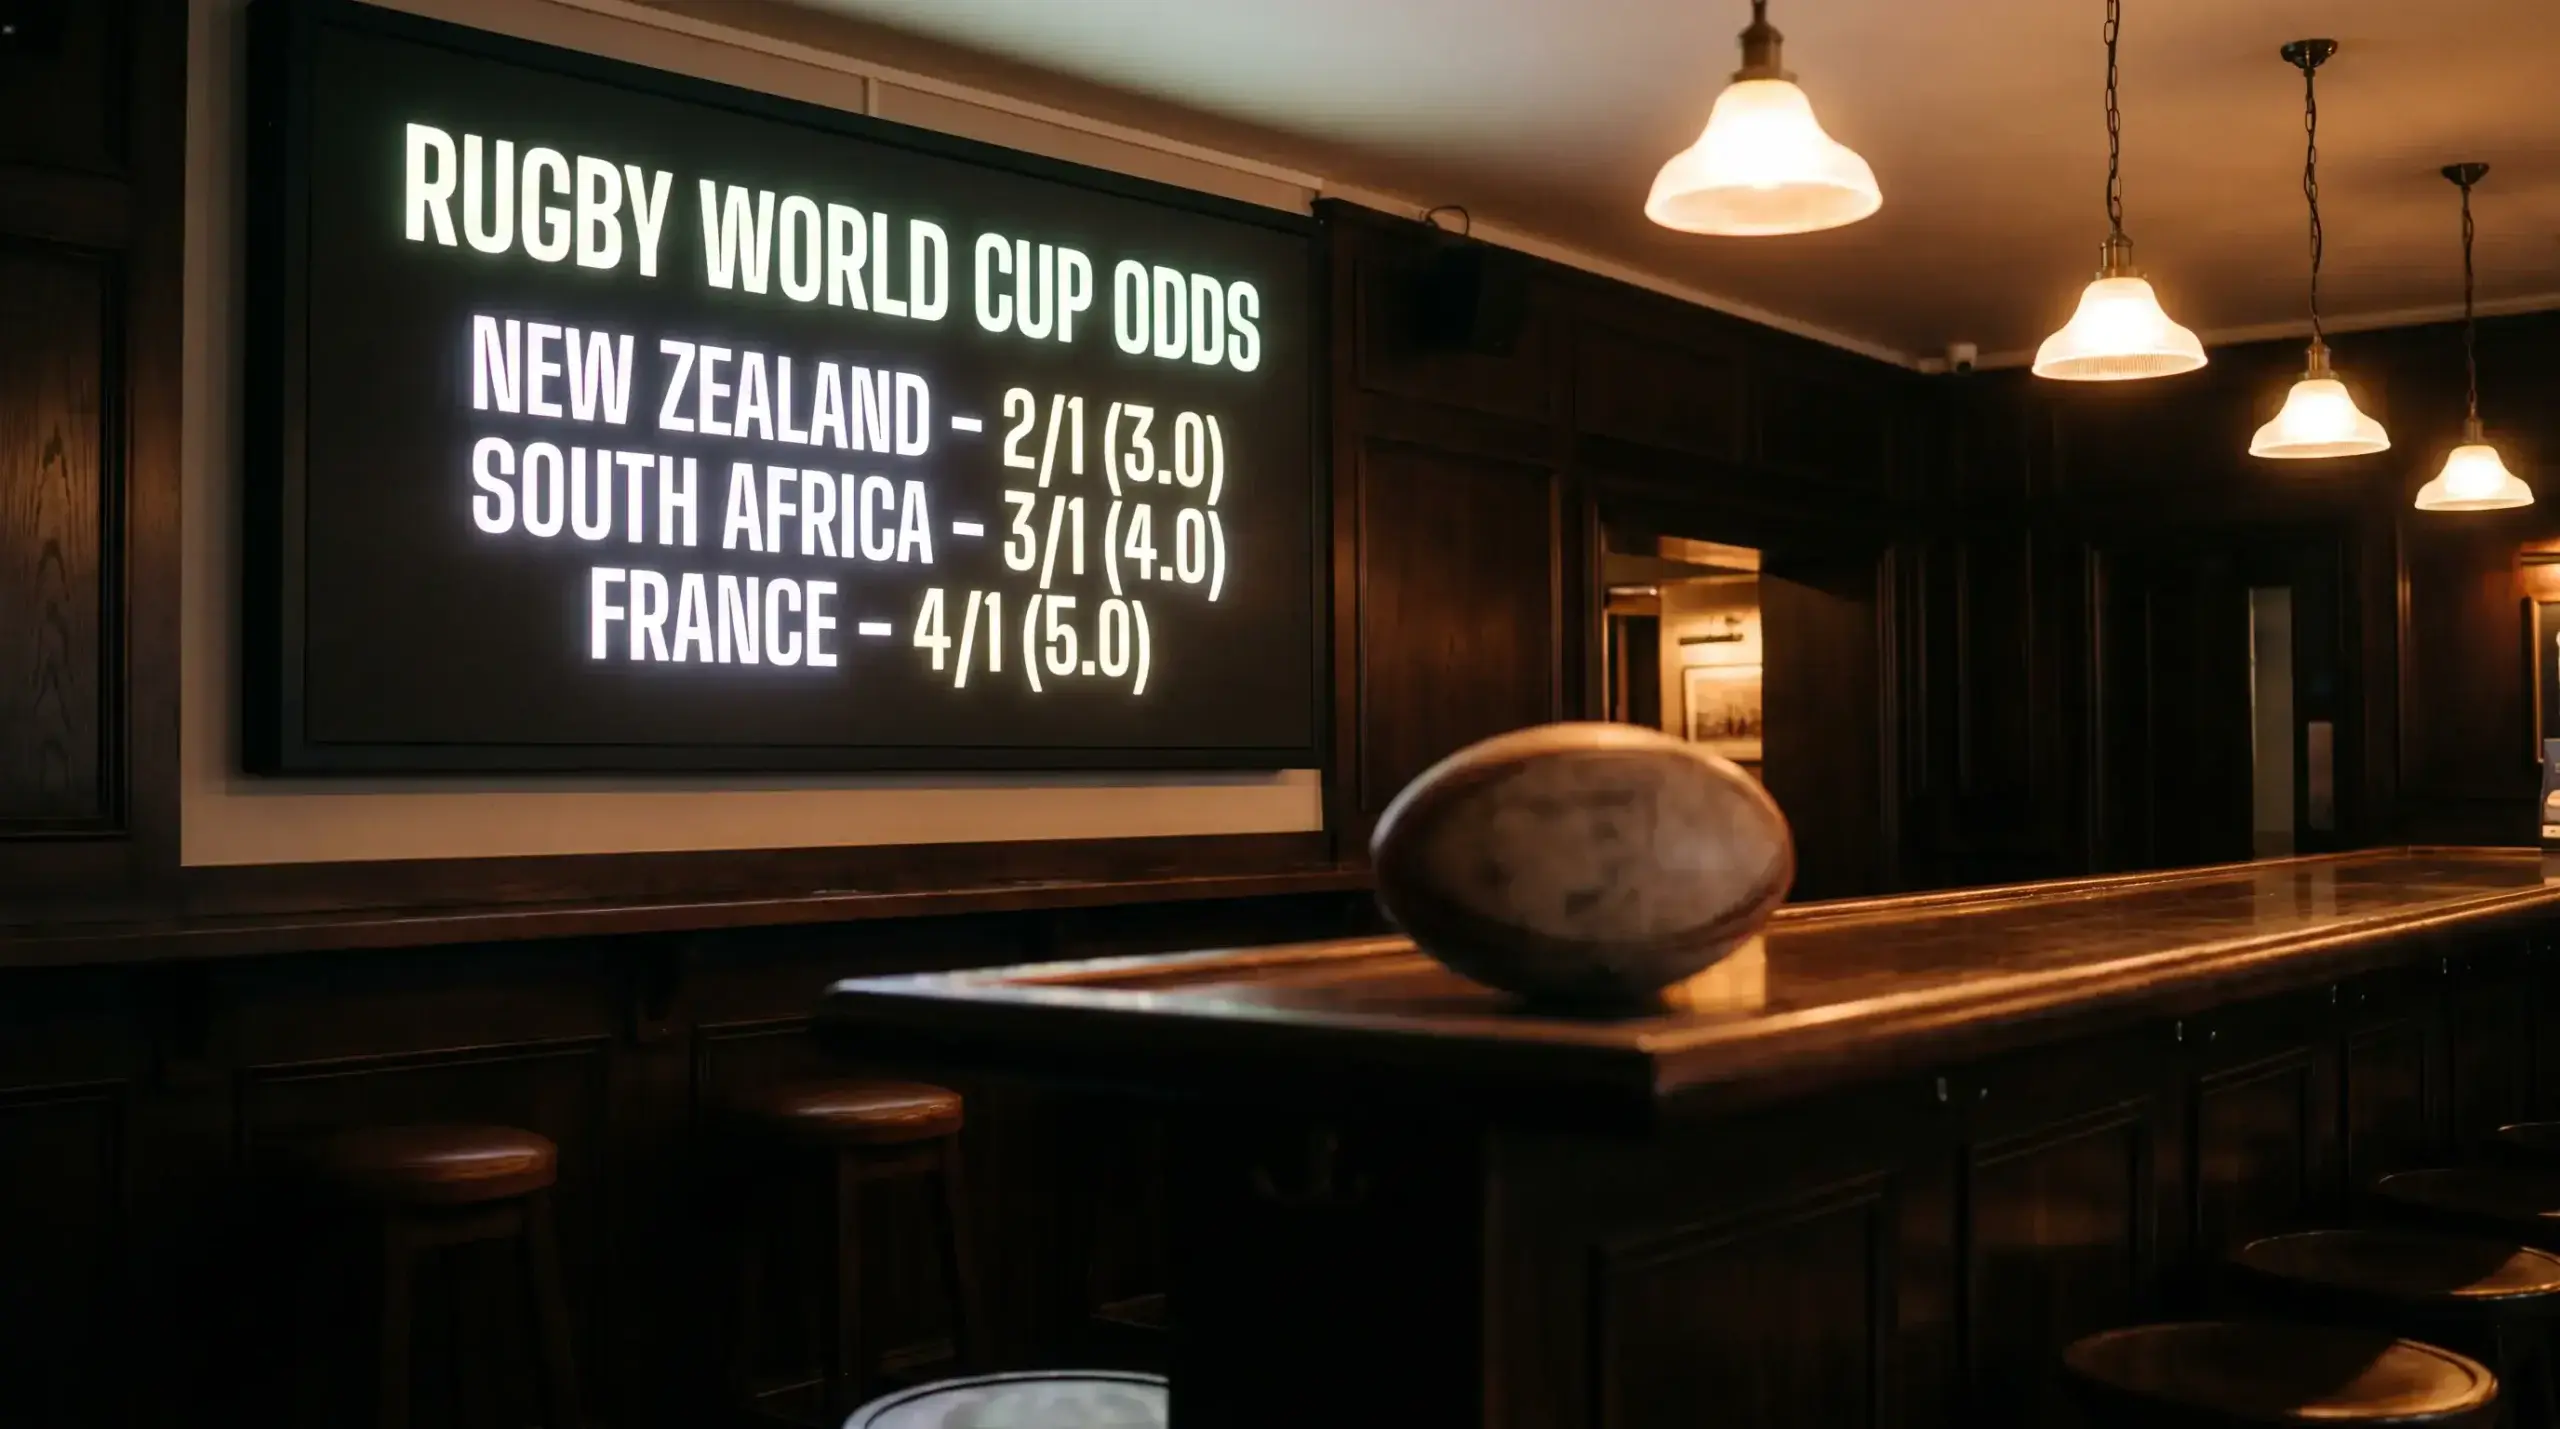
I want to walk you through how Rugby World Cup odds are constructed, where outright markets diverge from match prices, what drives the daily movement, how to compare numbers across UK sportsbooks without getting fooled by surface differences, and finally how to turn a price into a decision rather than a hunch. The numbers I quote — the New Zealand 3.50, the South Africa 3.75, France priced at roughly a one-in-five chance — are the early lines doing the rounds in the current 2027 cycle. They will move. The framework for reading them will not.
What a Rugby World Cup price actually represents
Here is the moment a lot of new bettors get caught: they treat the decimal number as a payout multiplier and stop there. They see 3.50 next to the All Blacks and think, “Right, ten quid back about thirty-five.” Mathematically correct. Strategically useless. The price is doing something far more interesting than telling you about returns.
Every odds quote is a probability statement dressed up as a multiplier. When South Africa is priced at decimal 3.75 to lift the Webb Ellis Cup, the bookmaker is saying — net of their margin — that the Springboks have roughly a 26 to 27 per cent chance of winning the tournament outright. Convert 1 divided by 3.75 and you get 0.2667. That is the implied probability. Strip out the bookmaker’s overround and the true assessed probability is a touch higher, but the principle holds: the price is an opinion about how likely something is, expressed as the inverse of a fraction.
This matters because it gives you a yardstick. If you genuinely believe South Africa wins this tournament three years out of ten, then 3.75 is roughly fair. If you think they win four times out of ten, you have value, because the price is paying you as if your view were wrong. If you think they win twice in ten, you are paying over the odds and the bookmaker is happy to take your money. The whole game I play, daily, is comparing my number against theirs.
The same logic shows you why France being priced around a 20 per cent implied probability is not a throwaway stat. It puts Les Bleus in the second tier of contenders behind the southern hemisphere giants and ahead of the rest of the pack. Their price says: one tournament in five, they walk away with the trophy. Agree or disagree, but at least you know what you are arguing with.
A word on formats. UK sportsbooks default to fractional odds — the 9/4 and 11/4 and 5/1 you see plastered across betting shops. Online, most of them let you flip to decimal in account settings. I run decimal almost exclusively because the maths is cleaner: stake multiplied by price equals total return, no mental arithmetic, no fiddling with adding the stake back in. If you are still finding the switching back and forth fiddly, I have a longer piece on how the two odds formats describe the same price differently, which covers the conversion mechanics in proper detail.

One last thing on what a price represents: it is a snapshot, not a forecast. It tells you what the market thinks right now, based on every piece of information currently in the public domain plus the weight of money already wagered. The moment a flanker rolls his ankle in a training video, the price changes. Treat odds as living things.
Why outright and match prices look like different animals
I once watched a punter at a betting counter in central London ask why his 5/1 on Ireland to win the World Cup was so much longer than the 4/9 on Ireland to beat Romania. He thought one of them had to be wrong. They were both correct. They were measuring different things.
The Rugby World Cup outright market — the futures market, the one where you back a team to lift the trophy — prices the entire tournament. It rolls up pool stage progression, knockout draw, injury exposure, refereeing variance, and the brutal fact that a single bad eighty minutes ends your bet. That is why even the shortest favourites trade above decimal 3.00. There is no team in world rugby that wins this competition more than one tournament in three at current strength.
Match prices are tighter because they only have to assess one fixture. New Zealand versus Namibia might trade at 1.01 to the All Blacks — a 99 per cent implied probability — because the gap between the two sides over eighty minutes is enormous. The same All Blacks side in the outright might sit around 3.50 because they have to win six matches in a row, several against opposition that could actually beat them on a given day. Compound probability is unforgiving.
This is the core insight I would write on a whiteboard if I were teaching this from scratch: a tournament price is a chain of match prices multiplied together, minus margin, plus uncertainty. If a team needs to win six knockouts and their average win probability across those six is 75 per cent, their pure outright probability is 0.75 to the power of six, which is just under 18 per cent — and that is before you even add pool stage risk. Suddenly a decimal 5.50 or 6.00 looks less generous.

The US market, incidentally, packages all this differently. You will sometimes see the All Blacks quoted at +250 and the Springboks at +300 in feeds aimed at American audiences. Those are moneyline conversions of the same underlying probabilities. The number is just a translation, but the maths underneath is identical to what UK books are doing — the bookmaker has an internal probability, applies a margin, and offers you the inverse as a price. The British shopfront just dresses it in fractions rather than plus signs.
Match markets also offer something outrights cannot: liquidity. Live cash flowing through a Friday night fixture creates tighter spreads, more market-makers competing, and prices that move in genuine response to play. Outright markets are sleepier and tend to lag. I trade both, but I expect different behaviour from each.
What actually moves a Rugby World Cup price
If you watch the outright market every morning the way I do, you start to spot four distinct kinds of movement, and only one of them tells you anything useful.
The first is information movement. A starting fly-half goes down in a Top 14 match, two months before the tournament, and that country’s price drifts overnight from 4.50 to 5.20. The market has digested a real event. This is what most punters assume all movement is, but it is honestly the smallest category by volume.
The second is positional movement. Books take a heavy book on one selection — say, England backed hard by patriotic UK money — and shorten the price not because their probability assessment changed but because their exposure did. They want to discourage further bets and rebalance the book. If you have your own model, this is gold: the price moved but the underlying truth did not. That is value waving at you.

The third is sentiment movement. A team puts together a glamorous warm-up win, the rugby press writes 800 words about a revival, and money piles on. Sentiment can be right, but it is usually overcorrected. I have made more money fading post-friendly bumps in price than backing them.
The fourth is what I call calendar movement. Outright prices on long-shot teams drift naturally as the tournament approaches and ante-post stake feels stale. Books need to attract money to the longer ends of the field, so prices on the third and fourth seeds in each pool tend to lengthen even when nothing has happened. This is structural, not informational.
Knowing which kind of movement you are looking at is the difference between reacting and chasing. Andrew Rhodes at the Gambling Commission once described Britain as “the largest licenced online market in the world”, and what comes with that scale is enormous price discovery. Every UK-licensed sportsbook is being moved by the same flows, the same news, the same models. When they all drift in the same direction overnight, something real happened. When only one or two move, it is positional. Reading the cluster, not the individual line, is half the job.
One more practical point. Prices tend to move sharpest in the 48 hours before kick-off, when team announcements land and final injury news shakes out. If you want to take a position based on an information edge, the window is usually mid-week, not Saturday morning when everyone else has caught up.
The outright market behaves differently again. There, the meaningful moves happen on a slower clock — across weeks rather than hours — and they cluster around three predictable triggers: the autumn international window, the spring Six Nations and Rugby Championship results, and the warm-up matches that bookend the tournament itself. Quiet stretches in between are exactly when slow books leave generous numbers lying around. I keep a calendar of those windows pinned next to my screen.
One trap to flag: a price that has not moved for weeks is not necessarily a stable price. It might be a forgotten price. Niche outright markets, especially top try scorer and pool-stage qualifying bets, can sit untouched while the underlying probabilities shift considerably. The first sharp punter to spot the disconnect gets paid; everyone else gets the corrected line that arrives an hour later.
How to compare numbers across UK sportsbooks without getting fooled
This is where most casual punters lose value without ever realising it. The same selection — New Zealand outright — might be priced at 3.40 at one UK sportsbook, 3.50 at another, and 3.65 at a third. Surface difference: 25 percentage points of return on every winning tenner. Real difference: the implied probability ranges from 27.4 per cent to 30.4 per cent. That three-point gap is the entire edge most professional bettors operate on.
So compare. Always. There are aggregator sites that show every UK book’s live price on a given market, and you should use them the way a tradesperson uses a tape measure. The notion that you should be loyal to “your bookmaker” is one the industry has been quietly grateful for since the dawn of the high street.
But here is the trap: not all higher prices are better prices. A genuinely longer number sometimes signals a smaller, less-confident book that has not yet caught up with sharper houses. If everyone moves a price to 3.40 and one outlier sits at 3.65, the outlier is either being generous or being slow. Slow books often move sharply once they realise, and your bet — even if accepted — can sit in limbo if the book then suspends or voids. I tend to take the best price from the top six or seven UK-licensed brands and ignore the deeper end of the long tail.

The second trap is margin. Books advertise their odds, not their overround. Add up the implied probabilities for every team in an outright market: if the total comes to 110 per cent, the book’s margin is 10 per cent. If it comes to 105 per cent, the margin is 5 per cent. The lower-margin book is offering systematically better prices across the whole field, even if any single number looks similar to a higher-margin competitor. Over a tournament’s worth of bets, that difference compounds brutally against you.

The third thing I check is liquidity. A price you cannot actually get on for a sensible stake is no price at all. UK sportsbooks do quietly limit accounts that win, and outright markets in particular have stake caps. Test the limit at low stakes before you build a position you cannot get filled.
Compare the same selection at the same moment in time across as many books as you sensibly can. Convert each quoted price to its implied probability so you are comparing apples to apples. Pick the one where the implied probability is lowest — that is the highest “true” price you are being offered. Repeat the exercise every time the market moves.
From a price on a screen to a decision in your bankroll
This is where the textbook ends and the actual job begins. You have read the price, you understand what it represents, you have compared it across the market, and you have a view on what is driving today’s movement. None of that has put a single pound at risk yet. The decision is the hardest part, because the decision is where you stop being an analyst and start being a punter.
My rule, applied without exception, is that I do not bet a Rugby World Cup outright unless my own assessed probability is at least three percentage points clear of the implied probability in the price. So if I think South Africa wins this tournament 30 per cent of the time and the price is implying 26.7 per cent — a 3.75 — I have an edge of 3.3 points. Marginal, but a bet. If the gap is smaller than three points, I pass. Variance over a six-week tournament will eat anything thinner.
The historical base rate is one of my most-used reality checks. New Zealand and South Africa have between them won seven of the ten Rugby World Cups ever staged. That is a 70 per cent strike rate between two teams. Any model I build that does not put those two in the top two slots is a model that has gone wrong somewhere. If a long-shot team’s price starts to tempt me, I make myself say out loud: “I am betting that this team beats the historical hit rate of the two greatest rugby nations of the modern era.” Usually that ends the discussion.
The flip side is that the All Blacks have lost more semi-finals than the public memory suggests, and the Springboks have won three of the last four tournaments while never being the longest-priced favourite. Translation: the obvious price is not always wrong, but the obvious story usually is. Stories drive amateur betting. Prices drive professional betting.
Once I have decided a price is value, I size the bet using a fixed fraction of bankroll — never more than 2 per cent on any single Rugby World Cup outright, regardless of how confident I feel. Confidence is the most expensive emotion in betting. The price tells you what the market thinks; the stake size tells you what your portfolio can survive. Treat them as separate decisions.
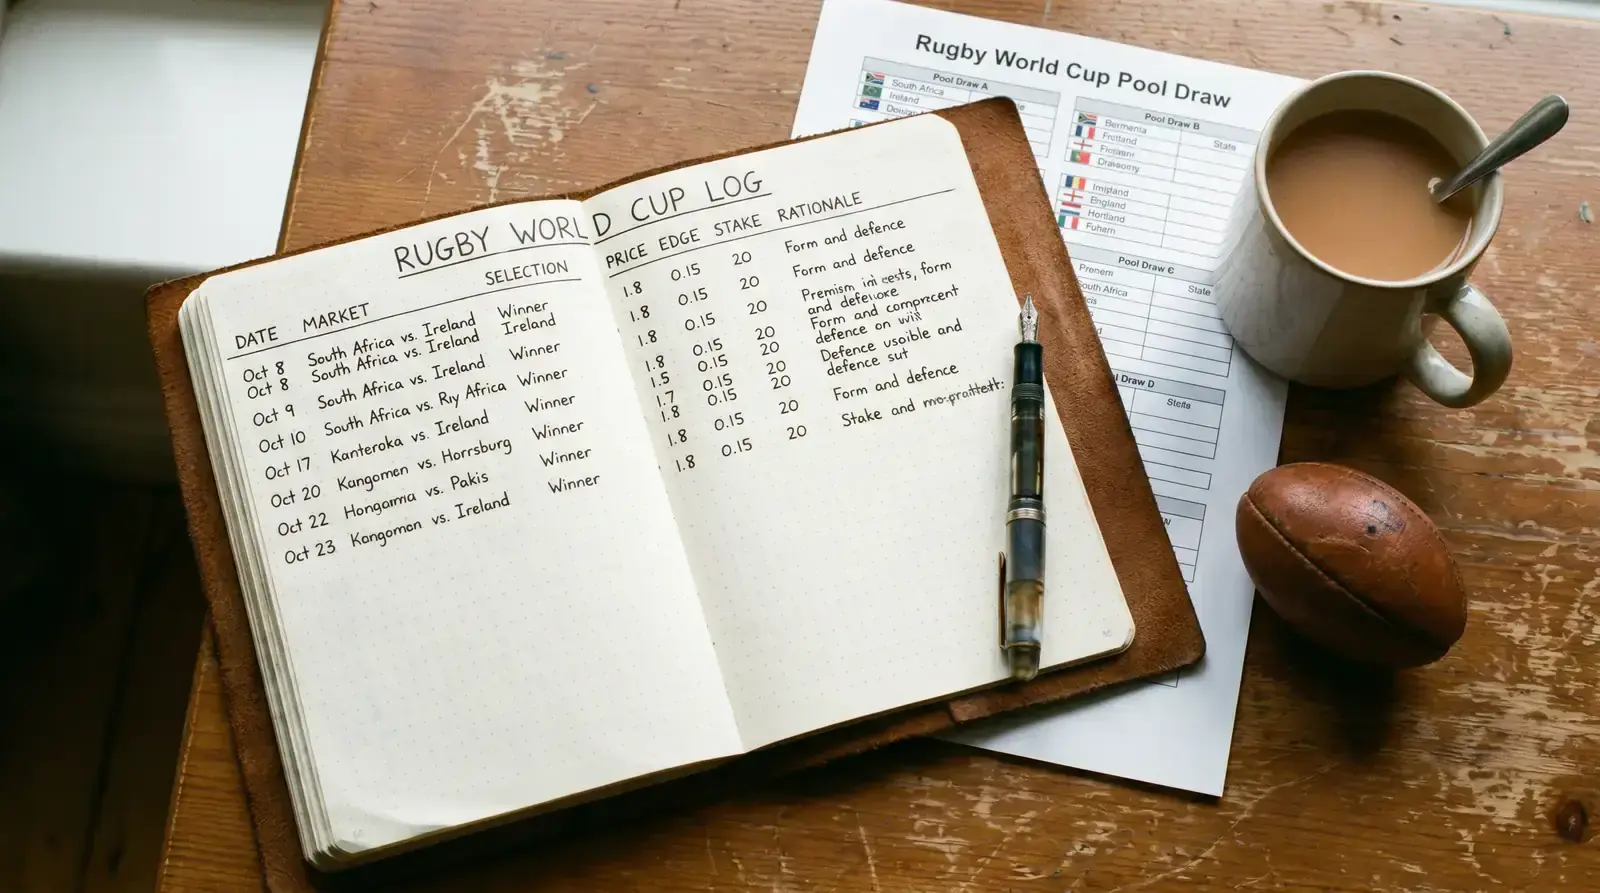
Finally, write your reasoning down before you place the bet. Not for anyone else to read, just for the version of you that will read it in three weeks when the price has moved. If you cannot justify the bet in two sentences on paper, you are not making a decision, you are scratching an itch. That habit has saved me more money than any model I have ever built.
I keep a simple log: date, market, selection, price taken, my own implied probability, edge in percentage points, stake as a fraction of bankroll, and one line of rationale. At the end of every tournament I sit down with that log and audit my own decisions. Were my probabilities calibrated? Did I overstate edges on teams I was emotionally attached to? Did I take prices that were already moving away from me? That review, repeated year after year, is what turns a hobbyist into someone who actually beats the line over time.
And if you are starting fresh on this 2027 cycle, my honest advice is to spend the first month not betting at all. Track the prices, write down what you would have backed, and then watch the market for a few weeks to see how reality unfolds against your hypothetical positions. The discipline of paper-trading a Rugby World Cup market for thirty days is worth more than any guide I or anyone else could write.
